 An infographic is a visual piece in which complex ideas are represented through a mixture of elements, such as maps, graphs, tables, sounds, illustrations, etc. Its main objective is to explain a message in a simpler, more attractive and summarized way. Its purpose is educational.
In the search for new strategies for knowledge transfer in the classroom, infographics have great potential, because:
An infographic is a visual piece in which complex ideas are represented through a mixture of elements, such as maps, graphs, tables, sounds, illustrations, etc. Its main objective is to explain a message in a simpler, more attractive and summarized way. Its purpose is educational.
In the search for new strategies for knowledge transfer in the classroom, infographics have great potential, because:
- They allow narrating stories accompanied by graphics and texts.
- They display attractive information for the general public.
- They expand the possibilities in teaching.
- They develop skills in the use of information sources.
- They consolidate habits of discipline, study and individual work, since they can be used as a study technique, but they also motivate collaborative and interdisciplinary work.
- They synthesize content with a strong visual charge, with varied designs depending on the theme.
- They stimulate creative thinking and mastery of ICT tools.
- In addition to all this, they serve for different types of ages; It can be used both in an infant class and in a university.
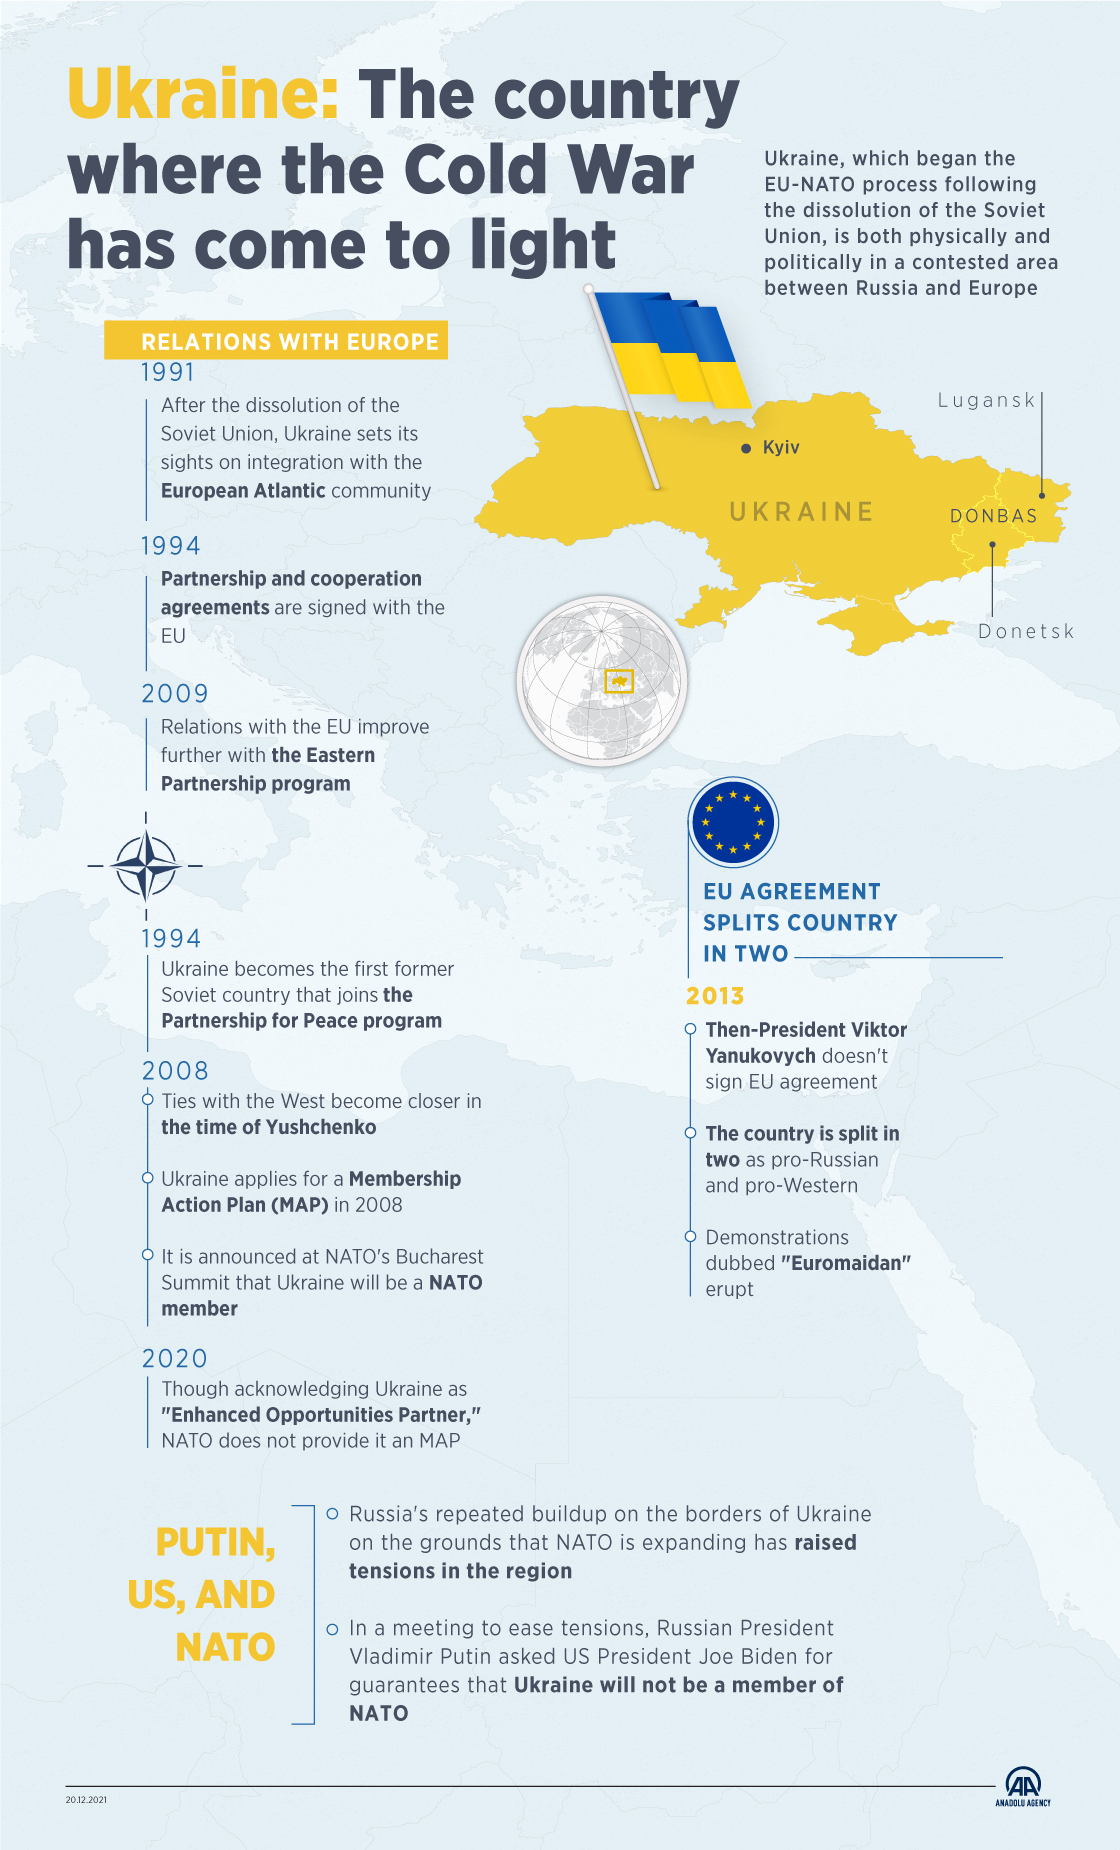
Infographic about the Cold War
Our intellect is visual
Within our research in different classrooms, we have been able to verify the importance of students actively participating in their learning process. If the students become the protagonist in the acquisition of their own knowledge, this will make them understand better and for a longer time. Our thinking is visual, especially in the age of screens in which we currently live. We are able to better understand the ideas that arise through visual concepts, and not only through abstract concepts, as are most of the concepts that are taught in the field of humanities. When we are presented with information, whether educational or journalistic, the first thing we do is read the headline. Later, we contemplate the images and finally, we are interested in the text. Several specialists have detected that students pay more attention to the drawings, images or signs in their books than to the text, although teachers rarely emphasize them. An image is not something passive, it not only exposes, but also manifests a problem, makes the viewer ask questions and arrive at a solution. With infographics you can improve classes, make them more enjoyable. We can get students to be able to remember a certain illustration, graph or map of the infographic, to explain complex concepts to define through it.Linked to knowledge from the origins
Infographics have always been a method of transmitting knowledge, although not as we know them now. Hieroglyphs (formed by a binomial of text and image) could be one of the first origins of infographics. The medieval bestiaries; cartographic maps; family tree diagrams; the various branches of scientific illustration (medicine, botany, engineering, etc.); the schematic, regulated and synthesized graphic stories of Leonardo da Vinci, who tried to transmit information with images supported by the text; the drawings and annotations on evolution, the natural sciences and the maps of Charles Darwin… All of them are mixtures of text and image that can be considered precursors of infographics. Its use is becoming more widespread. Especially, in a knowledge society where there is more and more information and what is important is not so much being able to memorize it as being able to discriminate what is the correct and important information.An alternative evaluation method
Although the exam is the most widely used means of evaluation, there are other written means (for example, the poster, the portfolio and the project) and oral means (for example, the debate, the presentation and the exhibition) that constitute student productions and They serve to demonstrate what they have learned. In this line, various studies have analyzed the potential of infographics as a teaching resource in the learning process. Over time, educational centers have been integrating resources to improve the work of teachers and help them in their work. From blackboards to, today, computers and tablets. Teachers have always used visual materials for their explanations. For example, a skeleton to give anatomy, three-dimensional figures to give geometry or minerals to give geology. All of these are used as mediation to communicate with the student more easily and reach their senses directly through their interaction with objects.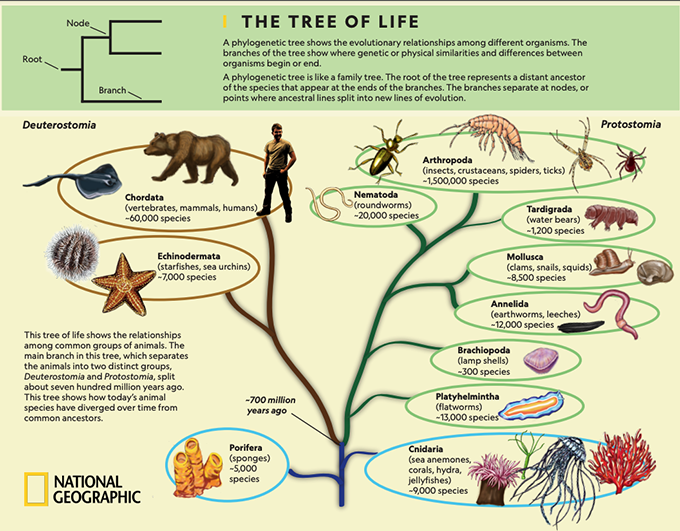
Infographics on Living Beings