 Australia’s love for fuel-hungry and fuel-inefficient SUVs is hampering our ability to bring transport emissions down. SUVs make up half of all new car sales last year, a National Transport Commission report revealed this week – up from a quarter of all sales a decade ago.
As a result, the carbon emitted by all new cars sold in Australia dropped only 2% in 2021, the report found. Sales of battery electric vehicles tripled last year, but still make up just 0.23% of all cars and light commercial vehicles on our roads.
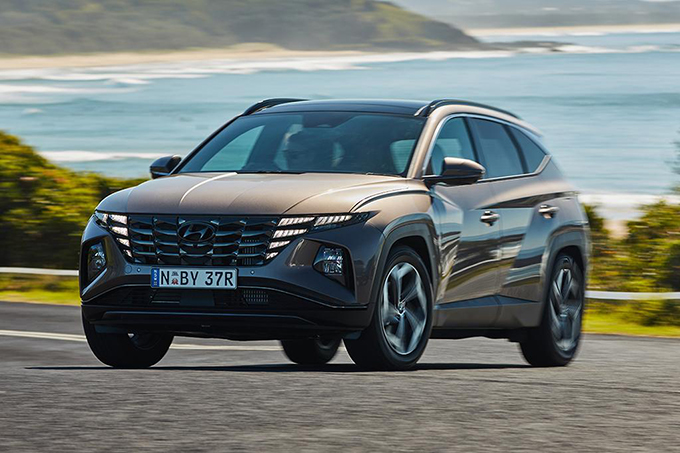
In internationally peer-reviewed research earlier this year, we measured the emissions of five SUVs driving around Sydney, and our findings suggest the situation may actually be worse than the new report finds.
The National Transport Commission’s numbers are based on the “New European Drive Cycle” (NEDC) emissions test. Our research found the real-world emissions of SUVs are, on average, about 30% higher than the NEDC values. This means we are not reducing fleet average emissions by a few percent per year, but actually probably increasing them by a few percent every year.
Australia’s love for fuel-hungry and fuel-inefficient SUVs is hampering our ability to bring transport emissions down. SUVs make up half of all new car sales last year, a National Transport Commission report revealed this week – up from a quarter of all sales a decade ago.
As a result, the carbon emitted by all new cars sold in Australia dropped only 2% in 2021, the report found. Sales of battery electric vehicles tripled last year, but still make up just 0.23% of all cars and light commercial vehicles on our roads.
In internationally peer-reviewed research earlier this year, we measured the emissions of five SUVs driving around Sydney, and our findings suggest the situation may actually be worse than the new report finds.
The National Transport Commission’s numbers are based on the “New European Drive Cycle” (NEDC) emissions test. Our research found the real-world emissions of SUVs are, on average, about 30% higher than the NEDC values. This means we are not reducing fleet average emissions by a few percent per year, but actually probably increasing them by a few percent every year.
What the report found
The transport sector is responsible for almost 20% of Australia’s emissions, ranking third behind the electricity and agriculture sector. The first year of the COVID pandemic only reduced transport carbon dioxide emissions by about 7%, compared to 2019 emission levels. Overall, Australia’s pride in carbon-belching transport is evident by the fact transport CO₂ emissions have risen 14% between 2005 and 2020. SUVs are generally larger and heavier than other passenger cars, which means they need quite a bit more energy and fuel per kilometre of driving when compared with smaller, lighter cars. Although SUV sales are rising globally, the Australian fleet is unique due to its large portion of SUVs in the on-road fleet, often with four-wheel-drive capability. According to the National Transport Commission report, sales of four-wheel-drives and utes surged by more than 43,000 in 2021, while large SUV sales rose by around 25,000.Rapidly shifting to electric cars is an important way to bring emissions down. But the report found in 2021, just 2.8% of Australia’s car sales were electric. Compare this to 17% in Europe, 16% in China and 5% in the United States. In Australia, there is still no option to buy an electric ute, and electric vehicles remain prohibitively expensive.Wild trend over the last decade of Australians shifting to bigger vehicles. “SUVs represented 25 per cent of total sales in 2011, they had increased to over half (53 per cent) of total sales in 2021.” pic.twitter.com/pCm0ASFYKd
— Michael Mazengarb (@MichaelM_ACT) September 15, 2022
Measuring SUV emissions in Sydney
There are a range of methods scientists use to measure vehicle emissions. One popular method worldwide uses so-called “on-board portable emission monitoring systems”. These systems are effective because they enable second-by-second emissions testing under a variety of real-world driving conditions on the road. On the other hand, the New European Drive Cycle (NEDC) emissions test is conducted in the laboratory. It was also developed in the early 1970s and reflects unrealistic driving behaviour, because test facilities at the time could not deal with significant changes in speed. We fitted five SUVs with a portable emission monitoring system and drove them a little over 100 kilometres around Sydney in various situations, such as in the city and on the freeway. We then compared our measurements with the Green Vehicle Guide – the national guide to vehicle fuel consumption and environmental performance, which is also based on the NEDC test. Our measurements of fuel consumption and CO₂ emissions were consistently higher. This varied from 16% to 65% higher than NEDC values, depending on the actual car and driving conditions. On average, real-world fuel consumption and CO₂ emissions were both 27% higher than NEDC values. Importantly, this gap has increased substantially from about 10% in 2008. Indeed, previous research from 2019 found fleet average greenhouse gas emissions for new Australian cars and SUVs has probably been increasing by 2-3% percent per year since 2015, rather than the reported annual reduction by, for instance, the National Transport Commission. This detailed analysis showed a sustained increase in vehicle weight and a shift to the sale of more four-wheel-drive cars (in other words, SUVs) are probably the main factors contributing to this change.More bad news for SUVs
We also recently summarised the results of various emission measurement campaigns conducted in Australia and compared them with international studies. These include results from a study of vehicle emissions in a tunnel, and a study of vehicle emissions measured on the road with remote sensing.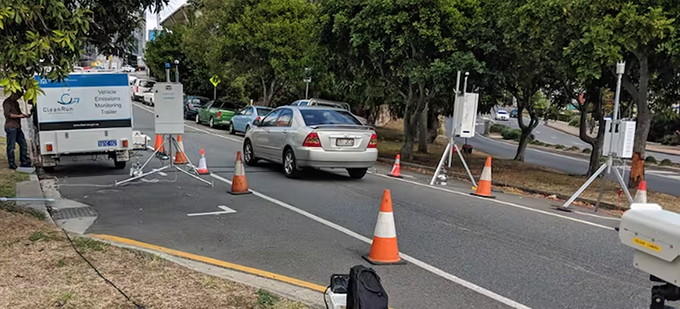
Measuring vehicle emissions with remote sensing in Brisbane. Robin Smit